Tracking Alfred: Maps show the cyclone’s impact
We’re sorry, this feature is currently unavailable. We’re working to restore it. Please try again later.
March 6, 2025
Credit: Matthew Absalom-Wong
, register or subscribe to save articles for later.
Add articles to your saved list and come back to them any time.
Cyclone Alfred continues to bear down on the South East Queensland coast and is expected to make landfall on Friday afternoon.
The category 2 storm is expected to bring heavy winds and rainfall as residents across the coast into northern NSW prepare for property damage, flooding and the loss of power.
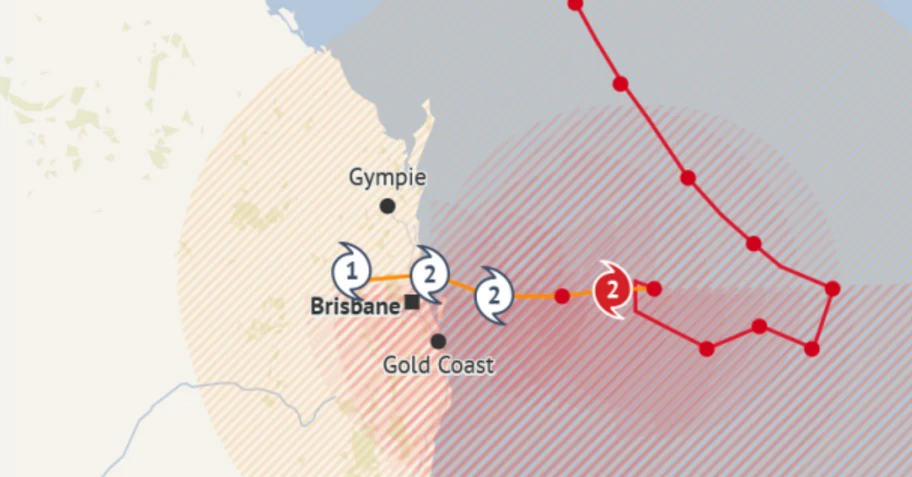
These maps show the cyclone’s likely path, using data from the Bureau of Meteorology and the Joint Typhoon Warning Centre, and projected danger areas, a high-resolution satellite video time-lapse plus an infographic that explains how cyclones form.
This is the latest projection of Alfred’s path and the danger areas.
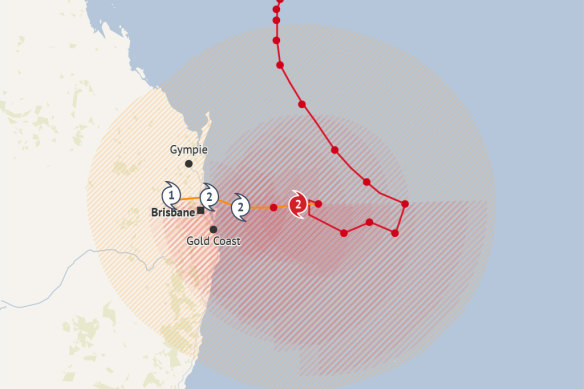
And the BoM’s latest map:
Here’s the path overlaid with satellite footage.
Here are the most up-to-date weather warnings.
This is a three-stage breakdown of how a cyclone forms.
We will continue to update this information through the course of the next few days as it comes to hand.
For the most up-to-date information, please follow our live coverage here.