- Nvidia shares will be in focus ahead of the AI chipmaker’s highly anticipated earnings report, due after the market close on Wednesday.
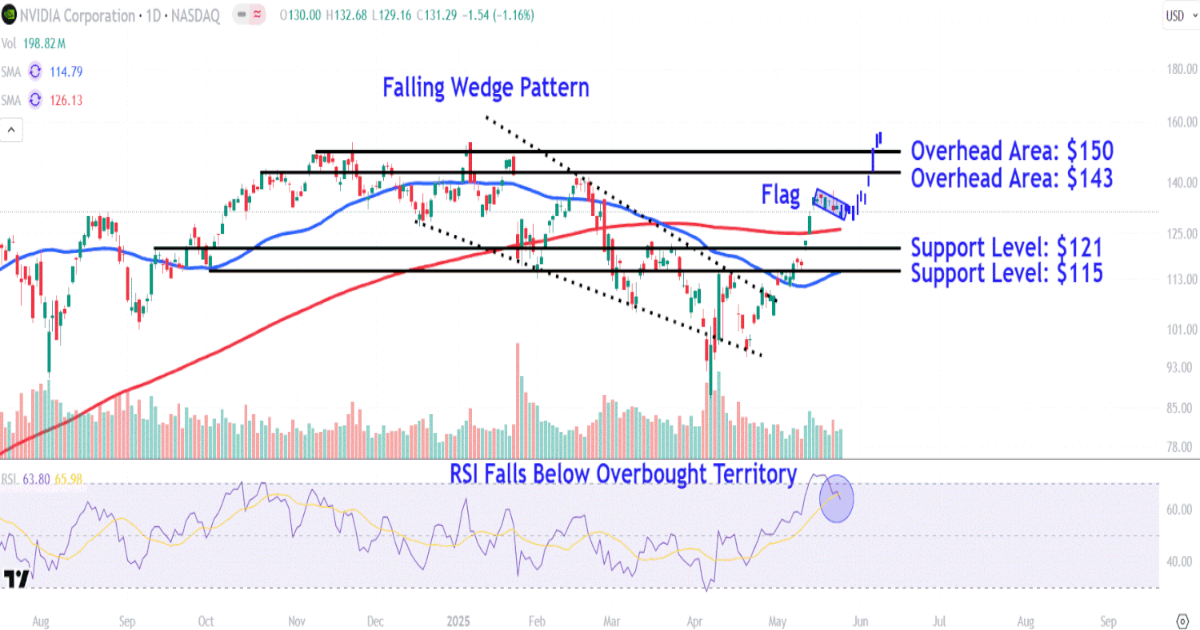
- The price has consolidated within a flag, a chart pattern that indicates a continuation of the stock’s uptrend.
- Investors should watch key overhead areas on Nvidia’s chart around $143 and $150, while also monitoring important support levels near $121 and $115.
Nvidia (NVDA) shares will be in focus ahead of the AI chipmaker’s highly anticipated earnings report, due after the market close on Wednesday.
Investors will be monitoring quarterly revenue growth for assurance that AI spending by big tech hyperscaler customers remains robust. Market watchers will also likely look for updates about the company’s sales to China after it warned earlier this year that it would record a $5.5 billion charge due to restrictions on its popular H20 chip after the Trump administration imposed tighter export controls.
Nvidia shares are down 2% since the start of 2025 but have rallied 52% from their early-April trough amid growing trade deal optimism and recent earnings reports from tech giants that forecast significant spending on AI infrastructure.
Below, we take a closer look at Nvidia’s chart and use technical analysis to point out key price levels worth watching out for.
Nvidia shares trended higher for several weeks after breaking out from a falling wedge. More recently, the price has consolidated within a flag, a chart pattern that indicates a continuation of the stock’s uptrend.
While the dip has coincided with the relative strength index falling below overbought territory, the indicator remains above the neutral threshold to confirm bullish price momentum ahead of the AI investor favorite’s quarterly report.
Let’s identify two key overhead areas on Nvidia’s chart worth watching while also locating important support levels to monitor during future pullbacks.
The first higher area to watch sits around $143. The shares may encounter resistance at this level near February’s prominent swing high, which also aligns with a range of corresponding trading activity on the chart extending back to late October.
Buying above this level could see a test of key overhead resistance at the $150 area. Investors who have accumulated shares at lower prices may look to lock in profits near a series of peaks that formed on the chart between November and January.
This location also sits just below a projected bars pattern target that takes the trending move following the breakout from the falling wedge and repositions it from the flag pattern’s lower trendline, speculating how a continuation move may play out.
A breakdown below the flag pattern could trigger selling to the $121 level. The shares may find support in this region near a horizontal line that connects the March countertrend peaks with last year’s early-September high.
Finally, selling below this level could see Nvidia shares fall to around $115. Investors may seek entry points in this region near the 50-day moving average and a range of peaks and troughs that developed on the chart between October and May.
The comments, opinions, and analyses expressed on Investopedia are for informational purposes only. Read our warranty and liability disclaimer for more info.
As of the date this article was written, the author does not own any of the above securities.