April 03, 2025, 19:38 pm ET, BY Allen K.- Contributor| Editor: Thomas H. Kee Jr. (Follow on LinkedIn)
Longer Term Trading Plans for GOOG
- NONE. Details
- There is no current Support Plan to trigger a buy of this stock at this time. This usually means that there are no clear support levels at this time, so buying the stock as it falls could be considered catching a falling knife. Buy signals only exist if resistance breaks higher.
- This often is a signal that the stock you are watching is weak. Waiting for a turn higher may be more intelligent than trying to catch a falling knife. In any case, new support levels are usually revised to the database at the beginning of the next trading session.
- Short GOOG slightly under 163.48, target n/a, stop loss @ 163.95 Details
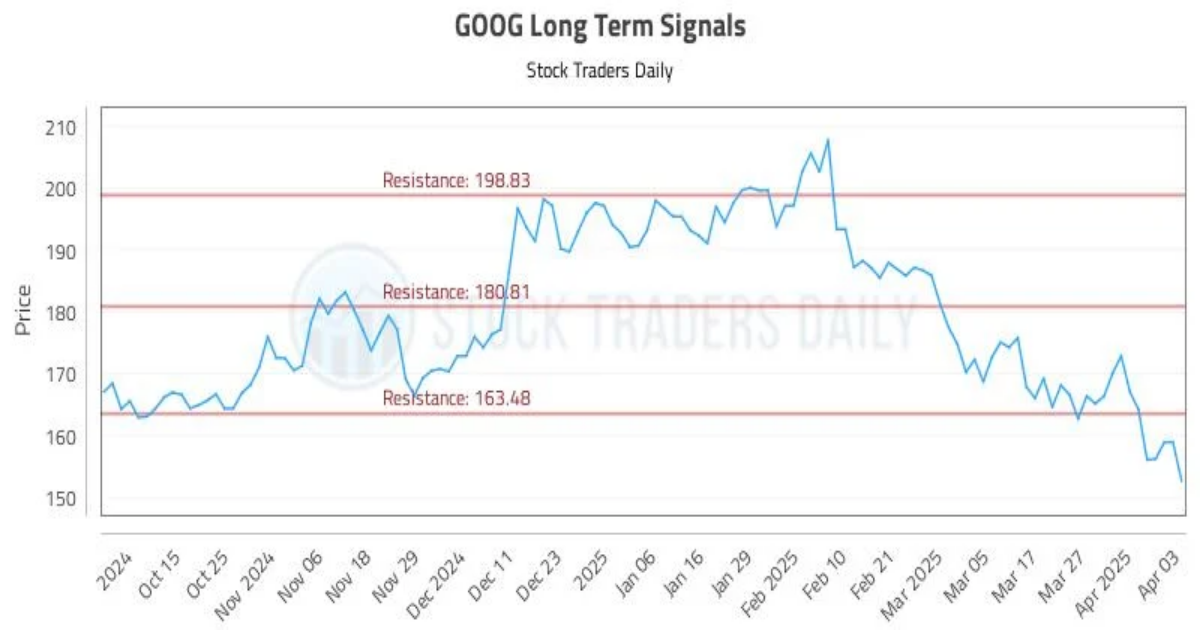
- The technical summary data is suggesting a short of GOOG as it gets near 163.48, but the downside target is not available from the current data. This tells us to hold that position if it is triggered until a new downside target has been established (updates occur at the beginning of every trading session) or until the position has been stopped. The summary data tells us to have a stop loss in place at 163.95. 163.48 is the first level of resistance above 152.56, and by rule, any test of resistance is a short signal. In this case, if resistance 163.48 is being tested, so a short signal would exist.
Swing Trading Plans for GOOG
- Buy GOOG slightly over 160.08, target 163.48, Stop Loss @ 159.62 Details
- If 160.08 begins to break higher, the technical summary data tells us to buy GOOG just slightly over 160.08, with an upside target of 163.48. The data also tells us to set a stop loss @ 159.62 in case the stock turns against the trade. 160.08 is the first level of resistance above 152.56, and by rule, any break above resistance is a buy signal. In this case, 160.08, initial resistance, would be breaking higher, so a buy signal would exist. Because this plan is based on a break of resistance, it is referred to as a Long Resistance Plan.
- Short GOOG slightly near 160.08, target 151, Stop Loss @ 160.54. Details
- The technical summary data is suggesting a short of GOOG if it tests 160.08 with a downside target of 151. We should have a stop loss in place at 160.54 though in case the stock begins to move against the trade. By rule, any test of resistance is a short signal. In this case, if resistance, 160.08, is being tested a short signal would exist. Because this plan is a short plan based on a test of resistance it is referred to as a Short Resistance Plan.
Day Trading Plans for GOOG
- Buy GOOG slightly over 152.91, target 157.85, Stop Loss @ 152.55 Details
- If 152.91 begins to break higher, the technical summary data tells us to buy GOOG just slightly over 152.91, with an upside target of 157.85. The data also tells us to set a stop loss @ 152.55 in case the stock turns against the trade. 152.91 is the first level of resistance above 152.56, and by rule, any break above resistance is a buy signal. In this case, 152.91, initial resistance, would be breaking higher, so a buy signal would exist. Because this plan is based on a break of resistance, it is referred to as a Long Resistance Plan.
- Short GOOG slightly near 152.91, target 151, Stop Loss @ 153.27. Details
- The technical summary data is suggesting a short of GOOG if it tests 152.91 with a downside target of 151. We should have a stop loss in place at 153.27 though in case the stock begins to move against the trade. By rule, any test of resistance is a short signal. In this case, if resistance, 152.91, is being tested a short signal would exist. Because this plan is a short plan based on a test of resistance it is referred to as a Short Resistance Plan.
Check the time stamp on this data. Updated AI-Generated Signals for Alphabet Inc. (GOOG) available here: GOOG.
GOOG Ratings for April 03:
⚠Triggers may have already come
AI Generated Signals for GOOG
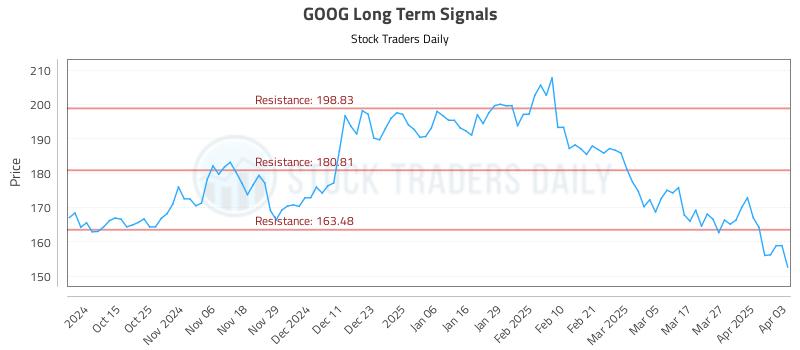
Blue = Current Price
Red= Resistance
Green = Support
Real Time Updates for Repeat Institutional Readers: